Coleraine
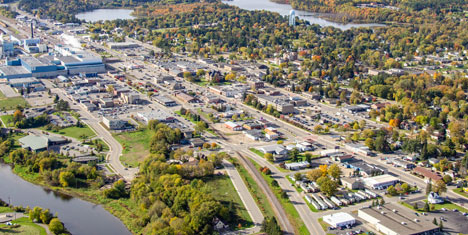
Coleraine sits just northeast of Grand Rapids along Highway 169 and the shores of Trout Lake. It is home to a Natural Resources Research Institute research lab and Greenway High School, which serves much of eastern Itasca County. Founded as a mining town in 1909, it now strives to offer “the best of small town living.”
Population
Back To Top
Back To Top
Population
| Population | 2000 | 2010 | 2025 | 2030 |
|---|---|---|---|---|
| Coleraine | 1,825 | 1,954 | 1,981 | 1,944 |
Source: ESRI, 2025-08-25
Population by Age
| Population | 2025 |
|---|---|
| 0-4 | 114 |
| 5-9 | 121 |
| 10-14 | 146 |
| 15-19 | 136 |
| 20-24 | 112 |
| 25-29 | 82 |
| 30-34 | 111 |
| 35-39 | 116 |
| 40-44 | 135 |
| 45-49 | 144 |
| 50-54 | 106 |
| 55-59 | 105 |
| 60-64 | 125 |
| 65-69 | 119 |
| 70-74 | 135 |
| 75-79 | 86 |
| 80-84 | 53 |
| 85+ | 35 |
| 18+ | 1,514 |
| Median Age | 42 |
Source: ESRI, 2025-08-25
Population by Race
| Coleraine | 2025 |
|---|---|
| Total | 1,981.00 |
| White Alone | 90.51% |
| Black Alone | 0.5% |
| American Indian Alone | 1.56% |
| Asian Alone | 0.15% |
| Pacific Islander Alone | 0% |
| Some Other Race | 0.35% |
| Two or More Races | 6.92% |
| Hispanic Origin | 1.67% |
| Diversity Index | 20.30 |
Source: ESRI, 2025-08-25
Growth Rate
| Coleraine | 2025 - 2030 |
|---|---|
| Population | -0.38% |
| Households | -0.32% |
| Families | -1.02% |
| Median Household Income | 3% |
| Per Capita Income | 2% |
Source: ESRI, 2025-08-25
Housing
Back To Top
Households
| Population | 2000 | 2010 | 2025 | 2030 |
|---|---|---|---|---|
| Households | 716 | 760 | 762 | 750 |
| Housing Units | 746 | 822 | 835 | 806 |
| Owner Occupied Units | 644 | 639 | ||
| Renter Occupied Units | 118 | 111 | ||
| Vacant Units | 73 | 56 |
Source: ESRI, 2025-08-25
Home Value
| Coleraine | 2025 | 2030 |
|---|---|---|
| Median Home Value | $245,495 | $354,891 |
| Average Home Value | $316,029 | $382,848 |
| <$50,000 | 26 | 26 |
| $50,000 - $99,999 | 35 | 12 |
| $100,000 - $149,999 | 85 | 39 |
| $150,000 - $199,999 | 75 | 58 |
| $200,000 - $249,999 | 111 | 91 |
| $250,000 - $299,999 | 45 | 43 |
| $300,000 - $399,999 | 83 | 92 |
| $400,000 - $499,999 | 109 | 165 |
| $500,000 - $749,999 | 35 | 55 |
| $1,000,000 + | 4 | 4 |
Source: ESRI, 2025-08-25
Housing Year Built
| Year Range | Houses Built |
|---|---|
| 2010 or Later | 27 |
| 2000-2009 | 153 |
| 1990-1999 | 95 |
| 1980-1989 | 64 |
| 1970-1979 | 97 |
| 1960-1969 | 101 |
| 1950-1959 | 46 |
| 1940-1949 | 81 |
| 1939 or Before | 124 |
Source: ESRI, 2025-08-25
Back To TopIncome
Back To Top
Income
| Coleraine | 2025 | 2030 |
|---|---|---|
| Median Household | $66,421 | $77,744 |
| Average Household | $84,456 | $92,894 |
| Per Capita | $32,501 | $35,854 |
Source: ESRI, 2025-08-25
Household Income
| Coleraine | 2025 |
|---|---|
| <$15,000 | 78 |
| $15,000 - $24,999 | 52 |
| $25,000 - $34,999 | 87 |
| $35,000 - $49,999 | 64 |
| $50,000 - $74,999 | 136 |
| $75,000 - $99,999 | 125 |
| $100,000 - $149,999 | 113 |
| $150,000 - $199,999 | 67 |
| $200,000+ | 40 |
Source: ESRI, 2025-08-25
Back To TopEmployees
Back To Top
Commute
| Category | Commuters |
|---|---|
| Workers 16+ | 788 |
| In-County Residents | 685 |
| Out-of-County Residents | 96 |
| Drive Alone | 621 |
| Carpooled | 104 |
| Public Transport | 5 |
| Work at Home | 42 |
| Motorcycle | 0 |
| Bicycle | 0 |
| Walked | 9 |
| Other | 8 |
| Less than 5 minutes | 57 |
| 5-9 minutes | 55 |
| 10-14 minutes | 189 |
| 15-19 minutes | 178 |
| 20-24 minutes | 93 |
| 25-29 minutes | 45 |
| 30-34 minutes | 51 |
| 35-39 minutes | 6 |
| 40-44 minutes | 2 |
| 45-59 minutes | 24 |
| 60-89 minutes | 22 |
| 90+ minutes | 23 |
| Average Travel Time | 0 |
Source: ESRI, 2025-08-25
Source: ESRI, 2025-08-25
Employees by NAICS
| Category | Number |
|---|---|
| Total Employees | 583 |
| Agr/Forestry/Fish/Hunt | 6 |
| Mining | 0 |
| Utilities | 4 |
| Construction | 23 |
| Manufacturing | 74 |
| Wholesale Trade | 22 |
| Retail Trade | 36 |
| Motor Veh/Parts Dealers | 11 |
| Furn & Home Furnish Str | 0 |
| Electronics & Appl Store | 3 |
| Bldg Matl/Garden Equip | 2 |
| Food & Beverage Stores | 14 |
| Health/Pers Care Stores | 0 |
| Gasoline Stations | 4 |
| Clothing/Accessory Store | 0 |
| Sports/Hobby/Book/Music | 2 |
| General Merchandise Str | 0 |
| Transportation/Warehouse | 1 |
| Information | 0 |
| Finance & Insurance | 25 |
| Cntrl Bank/Crdt Intrmdtn | 18 |
| Sec/Cmdty Cntrct/Oth Inv | 0 |
| Insur/Funds/Trusts/Other | 7 |
| Real Estate/Rent/Leasing | 7 |
| Prof/Scientific/Tech Srv | 14 |
| Legal Services | 0 |
| Mgmt of Comp/Enterprises | 2 |
| Admin/Support/Waste Mgmt | 4 |
| Educational Services | 139 |
| HealthCare/Social Assist | 99 |
| Arts/Entertainment/Rec | 14 |
| Accommodation/Food Srvcs | 35 |
| Accommodation | 19 |
| Food Srv/Drinking Places | 16 |
| Other Srv excl Pub Admin | 72 |
| Auto Repair/Maintenance | 14 |
| Public Administration Emp | 6 |
Source: ESRI, 2025-08-25
Educational Attainment (25+)
| Coleraine | 2025 |
|---|---|
| <9th Grade | 1 |
| Some High School | 43 |
| GED | 77 |
| Graduated High School | 317 |
| Some College/No Degree | 353 |
| Associates Degree | 222 |
| Bachelor's Degree | 268 |
| Graduate Degree | 71 |
Source: ESRI, 2025-08-25
Back To TopBusinesses
Back To Top
Businesses by NAICS
| Category | Number |
|---|---|
| Total Businesses | 94 |
| Agr/Forestry/Fish/Hunt Bus | 3 |
| Mining Bus | 0 |
| Utilities Bus | 1 |
| Construction Bus | 7 |
| Manufacturing Bus | 10 |
| Wholesale Trade Bus | 6 |
| Retail Trade Bus | 8 |
| Motor Veh/Parts Dealers Bus | 2 |
| Furn & Home Furnish Str Bus | 0 |
| Electronics & Appl Store Bus | 1 |
| Bldg Matl/Garden Equip Bus | 1 |
| Food & Beverage Stores Bus | 2 |
| Health/Pers Care Stores Bus | 0 |
| Gasoline Stations Bus | 1 |
| Clothing/Accessory Store Bus | 0 |
| Sports/Hobby/Book/Music Bus | 1 |
| General Merchandise Str Bus | 0 |
| Transportation/Warehouse Bus | 1 |
| Information Bus | 0 |
| Finance & Insurance Bus | 3 |
| Cntrl Bank/Crdt Intrmdtn Bus | 1 |
| Sec/Cmdty Cntrct/Oth Inv Bus | 0 |
| Insur/Funds/Trusts/Other Bus | 2 |
| Real Estate/Rent/Leasing Bus | 4 |
| Prof/Scientific/Tech Srv Bus | 6 |
| Legal Services Bus | 0 |
| Mgmt of Comp/Enterprises Bus | 1 |
| Admin/Support/Waste Mgmt Bus | 2 |
| Educational Services Bus | 4 |
| HealthCare/Social Assist Bus | 8 |
| Arts/Entertainment/Rec Bus | 4 |
| Accommodation/Food Srvcs Bus | 4 |
| Accommodation Bus | 2 |
| Food Srv/Drinking Places Bus | 2 |
| Other Srv excl Pub Admin Bus | 17 |
| Auto Repair/Maintenance Bus | 7 |
| Public Administration Bus | 2 |
Source: ESRI, 2025-08-25
Back To Top