Grand Rapids
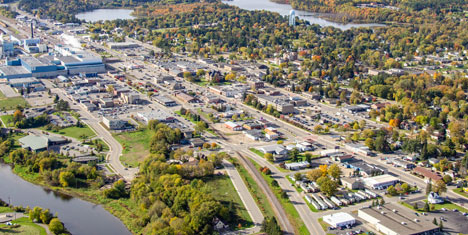
Grand Rapids is the county seat and largest city in Itasca County. Its central location makes it a commercial hub for Itasca County and many areas beyond, and its economy combines a strong industrial base with flourishing tourism and retail sectors. It is home to Grand Rapids High School, Itasca Community College, and a wealth of cultural opportunities for a community of its size.
Population
Back To Top
Back To Top
Population
| Population | 2000 | 2010 | 2025 | 2030 |
|---|---|---|---|---|
| Grand Rapids | 10,286 | 10,841 | 11,239 | 11,213 |
Source: ESRI, 2025-08-25
Population by Age
| Population | 2025 |
|---|---|
| 0-4 | 651 |
| 5-9 | 655 |
| 10-14 | 688 |
| 15-19 | 714 |
| 20-24 | 698 |
| 25-29 | 529 |
| 30-34 | 667 |
| 35-39 | 700 |
| 40-44 | 653 |
| 45-49 | 630 |
| 50-54 | 528 |
| 55-59 | 555 |
| 60-64 | 691 |
| 65-69 | 758 |
| 70-74 | 682 |
| 75-79 | 540 |
| 80-84 | 426 |
| 85+ | 474 |
| 18+ | 8,824 |
| Median Age | 42 |
Source: ESRI, 2025-08-25
Population by Race
| Grand Rapids | 2025 |
|---|---|
| Total | 11,239.00 |
| White Alone | 89.81% |
| Black Alone | 1.04% |
| American Indian Alone | 1.96% |
| Asian Alone | 0.61% |
| Pacific Islander Alone | 0.02% |
| Some Other Race | 0.5% |
| Two or More Races | 6.07% |
| Hispanic Origin | 1.82% |
| Diversity Index | 21.80 |
Source: ESRI, 2025-08-25
Growth Rate
| Grand Rapids | 2025 - 2030 |
|---|---|
| Population | -0.05% |
| Households | -0.08% |
| Families | -0.36% |
| Median Household Income | 2% |
| Per Capita Income | 2% |
Source: ESRI, 2025-08-25
Housing
Back To Top
Households
| Population | 2000 | 2010 | 2025 | 2030 |
|---|---|---|---|---|
| Households | 4,319 | 4,601 | 4,802 | 4,782 |
| Housing Units | 4,546 | 4,894 | 5,191 | 5,137 |
| Owner Occupied Units | 2,963 | 2,963 | ||
| Renter Occupied Units | 1,839 | 1,819 | ||
| Vacant Units | 389 | 355 |
Source: ESRI, 2025-08-25
Home Value
| Grand Rapids | 2025 | 2030 |
|---|---|---|
| Median Home Value | $238,243 | $299,387 |
| Average Home Value | $268,815 | $330,150 |
| <$50,000 | 133 | 142 |
| $50,000 - $99,999 | 117 | 47 |
| $100,000 - $149,999 | 302 | 147 |
| $150,000 - $199,999 | 505 | 302 |
| $200,000 - $249,999 | 555 | 481 |
| $250,000 - $299,999 | 357 | 367 |
| $300,000 - $399,999 | 569 | 736 |
| $400,000 - $499,999 | 319 | 513 |
| $500,000 - $749,999 | 63 | 121 |
| $1,000,000 + | 21 | 53 |
Source: ESRI, 2025-08-25
Housing Year Built
| Year Range | Houses Built |
|---|---|
| 2010 or Later | 564 |
| 2000-2009 | 537 |
| 1990-1999 | 577 |
| 1980-1989 | 700 |
| 1970-1979 | 863 |
| 1960-1969 | 538 |
| 1950-1959 | 565 |
| 1940-1949 | 359 |
| 1939 or Before | 373 |
Source: ESRI, 2025-08-25
Back To TopIncome
Back To Top
Income
| Grand Rapids | 2025 | 2030 |
|---|---|---|
| Median Household | $59,708 | $65,429 |
| Average Household | $76,602 | $84,037 |
| Per Capita | $32,805 | $35,915 |
Source: ESRI, 2025-08-25
Household Income
| Grand Rapids | 2025 |
|---|---|
| <$15,000 | 555 |
| $15,000 - $24,999 | 523 |
| $25,000 - $34,999 | 338 |
| $35,000 - $49,999 | 549 |
| $50,000 - $74,999 | 959 |
| $75,000 - $99,999 | 676 |
| $100,000 - $149,999 | 791 |
| $150,000 - $199,999 | 218 |
| $200,000+ | 193 |
Source: ESRI, 2025-08-25
Back To TopEmployees
Back To Top
Commute
| Category | Commuters |
|---|---|
| Workers 16+ | 4,648 |
| In-County Residents | 4,253 |
| Out-of-County Residents | 350 |
| Drive Alone | 3,260 |
| Carpooled | 471 |
| Public Transport | 177 |
| Work at Home | 360 |
| Motorcycle | 16 |
| Bicycle | 103 |
| Walked | 195 |
| Other | 66 |
| Less than 5 minutes | 285 |
| 5-9 minutes | 1,429 |
| 10-14 minutes | 1,188 |
| 15-19 minutes | 506 |
| 20-24 minutes | 276 |
| 25-29 minutes | 67 |
| 30-34 minutes | 92 |
| 35-39 minutes | 0 |
| 40-44 minutes | 29 |
| 45-59 minutes | 172 |
| 60-89 minutes | 167 |
| 90+ minutes | 77 |
| Average Travel Time | 0 |
Source: ESRI, 2025-08-25
Source: ESRI, 2025-08-25
Employees by NAICS
| Category | Number |
|---|---|
| Total Employees | 11,053 |
| Agr/Forestry/Fish/Hunt | 6 |
| Mining | 8 |
| Utilities | 6 |
| Construction | 328 |
| Manufacturing | 927 |
| Wholesale Trade | 92 |
| Retail Trade | 1,775 |
| Motor Veh/Parts Dealers | 179 |
| Furn & Home Furnish Str | 71 |
| Electronics & Appl Store | 14 |
| Bldg Matl/Garden Equip | 288 |
| Food & Beverage Stores | 369 |
| Health/Pers Care Stores | 102 |
| Gasoline Stations | 15 |
| Clothing/Accessory Store | 83 |
| Sports/Hobby/Book/Music | 132 |
| General Merchandise Str | 522 |
| Transportation/Warehouse | 122 |
| Information | 237 |
| Finance & Insurance | 356 |
| Cntrl Bank/Crdt Intrmdtn | 180 |
| Sec/Cmdty Cntrct/Oth Inv | 97 |
| Insur/Funds/Trusts/Other | 79 |
| Real Estate/Rent/Leasing | 179 |
| Prof/Scientific/Tech Srv | 440 |
| Legal Services | 54 |
| Mgmt of Comp/Enterprises | 23 |
| Admin/Support/Waste Mgmt | 321 |
| Educational Services | 803 |
| HealthCare/Social Assist | 2,851 |
| Arts/Entertainment/Rec | 161 |
| Accommodation/Food Srvcs | 950 |
| Accommodation | 77 |
| Food Srv/Drinking Places | 873 |
| Other Srv excl Pub Admin | 744 |
| Auto Repair/Maintenance | 110 |
| Public Administration Emp | 724 |
Source: ESRI, 2025-08-25
Educational Attainment (25+)
| Grand Rapids | 2025 |
|---|---|
| <9th Grade | 85 |
| Some High School | 293 |
| GED | 158 |
| Graduated High School | 2,208 |
| Some College/No Degree | 1,521 |
| Associates Degree | 1,057 |
| Bachelor's Degree | 1,404 |
| Graduate Degree | 1,107 |
Source: ESRI, 2025-08-25
Back To TopBusinesses
Back To Top
Businesses by NAICS
| Category | Number |
|---|---|
| Total Businesses | 965 |
| Agr/Forestry/Fish/Hunt Bus | 1 |
| Mining Bus | 2 |
| Utilities Bus | 1 |
| Construction Bus | 44 |
| Manufacturing Bus | 31 |
| Wholesale Trade Bus | 23 |
| Retail Trade Bus | 136 |
| Motor Veh/Parts Dealers Bus | 19 |
| Furn & Home Furnish Str Bus | 8 |
| Electronics & Appl Store Bus | 3 |
| Bldg Matl/Garden Equip Bus | 14 |
| Food & Beverage Stores Bus | 22 |
| Health/Pers Care Stores Bus | 16 |
| Gasoline Stations Bus | 3 |
| Clothing/Accessory Store Bus | 14 |
| Sports/Hobby/Book/Music Bus | 27 |
| General Merchandise Str Bus | 10 |
| Transportation/Warehouse Bus | 16 |
| Information Bus | 29 |
| Finance & Insurance Bus | 70 |
| Cntrl Bank/Crdt Intrmdtn Bus | 20 |
| Sec/Cmdty Cntrct/Oth Inv Bus | 29 |
| Insur/Funds/Trusts/Other Bus | 21 |
| Real Estate/Rent/Leasing Bus | 44 |
| Prof/Scientific/Tech Srv Bus | 68 |
| Legal Services Bus | 16 |
| Mgmt of Comp/Enterprises Bus | 2 |
| Admin/Support/Waste Mgmt Bus | 27 |
| Educational Services Bus | 24 |
| HealthCare/Social Assist Bus | 140 |
| Arts/Entertainment/Rec Bus | 20 |
| Accommodation/Food Srvcs Bus | 58 |
| Accommodation Bus | 9 |
| Food Srv/Drinking Places Bus | 49 |
| Other Srv excl Pub Admin Bus | 157 |
| Auto Repair/Maintenance Bus | 22 |
| Public Administration Bus | 56 |
Source: ESRI, 2025-08-25
Back To Top